U.S. Bus Accident Statistics
Note: This content originally published on https://www.paulsoncoletti.com/bus-accident-statistics/
In the United States, buses are relied upon to transport large groups of people and carry our children to and from school. Annually, as many as 700 million people travel by bus. Passengers, other motorists, and their families have a reasonable expectation that they will safely arrive at their destinations.
Unfortunately, this isn’t always the case.
While collisions involving buses make up only a small portion of the total fatal accidents each year, the results are usually tragic. In fact, the NTSB has found that, per vehicle, buses and other commercial motor vehicles are more likely to be involved in fatal crashes than passenger vehicles.
- In 2018, a drunk school bus driver collided with a dump truck, killing a 10-year-old student and a teacher in Carrolton, Texas.
- On February 22, 2020 a charter bus carrying 21 people overturned in San Diego, CA, leaving three dead and another eighteen injured.
Even when passengers are kept safe, poor sightlines from the vehicle and negligent bus drivers can put pedestrians, cyclists, and passenger vehicle occupants at risk. In fact, historically, only 13 percent of those killed in bus accidents are occupants.
When, where, and how often do buses crash?
At Paulson Coletti, we’ve represented families who have lost loved ones in bus collisions and we have seen the devastation that a deadly bus accident can bring. As a service to those affected by or interested in bus safety, we’ve compiled the most comprehensive list of bus accident statistics and information available online.
How Often Do Buses Crash?
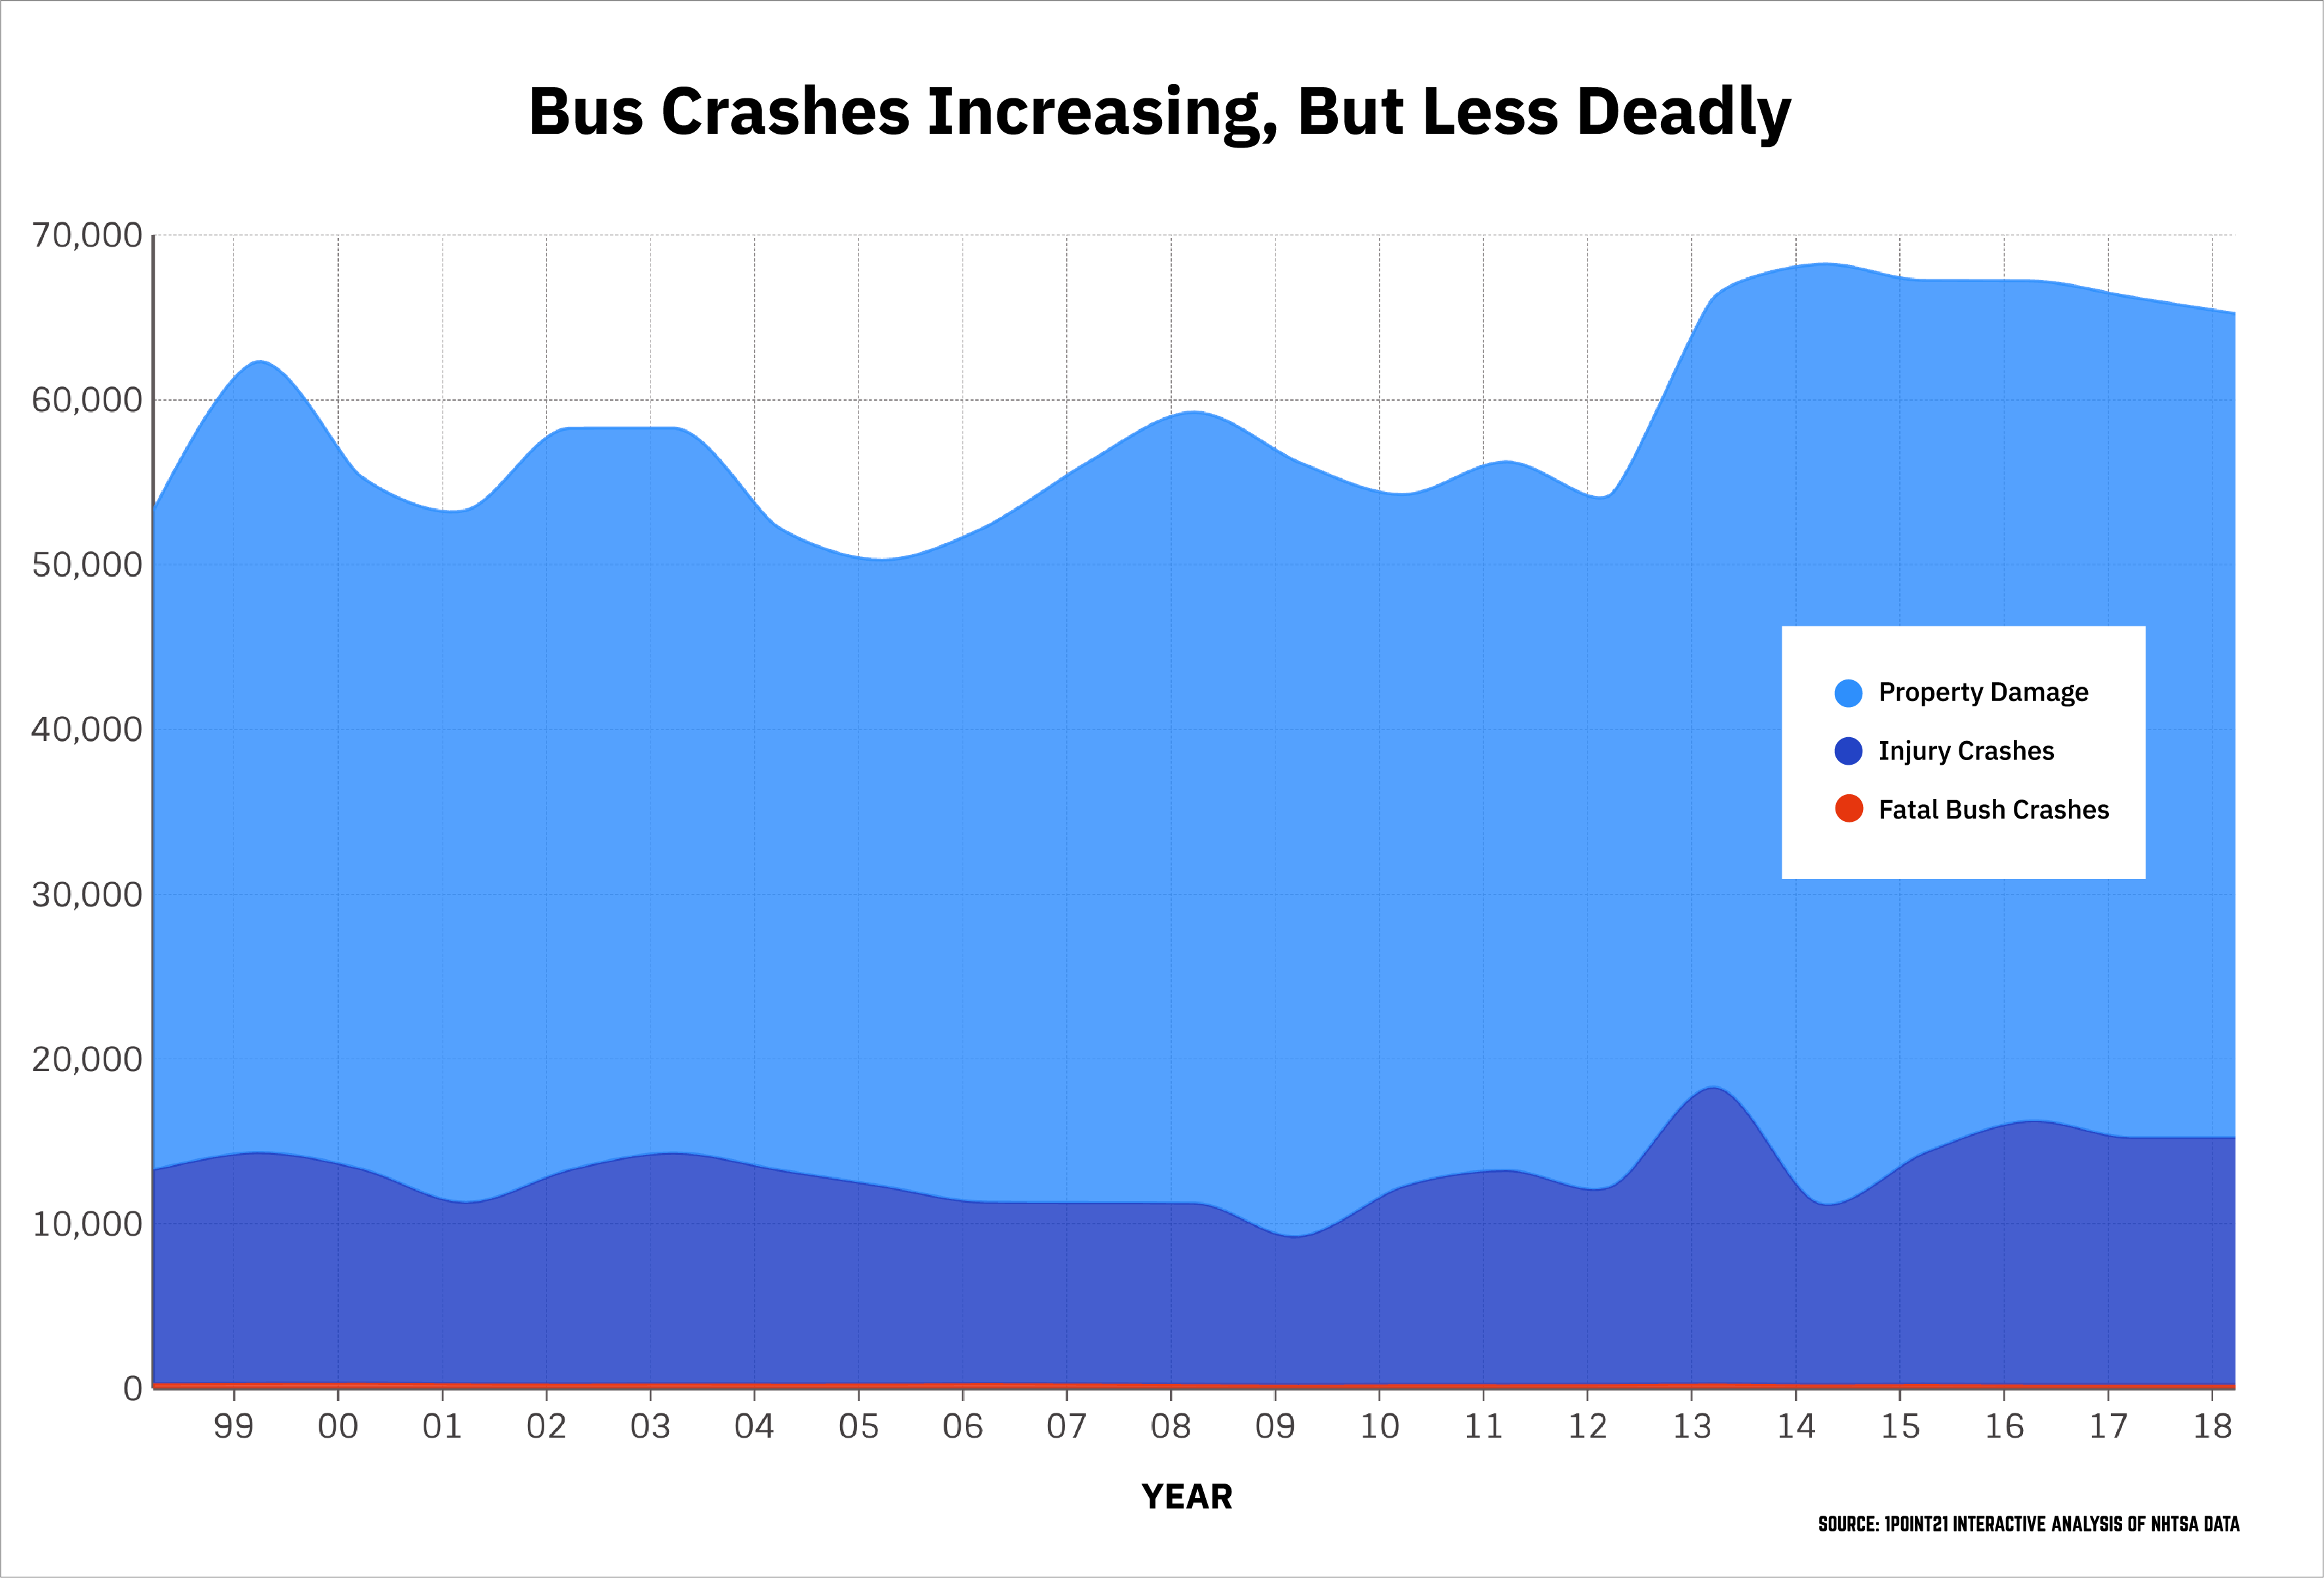
On average, there are nearly 60,000 bus accidents each year in the United States. While most of these collisions result in property damage only, hundreds of people are killed and thousands more are injured. Researchers estimate that as many as 14,000 injuries occur in these crashes. Data shows that even though the number of bus crashes has increased over time, there are fewer fatal crashes.

From 2000 to 2018, fatal bus crashes have declined by 29 percent, while injury crashes have risen by 15 percent. In 2000, there were 323 fatal bus crashes, compared to 230 fatal bus crashes in 2018. However, in the case of injury crashes, the numbers rose from 13,000 in 2000 to 15,000 in 2018. Bus safety is regulated at state and federal levels and school buses are known to be some of the most regulated vehicles on the road. That may contribute to the decline of fatal bus crashes.
| Year | Fatal Bus Crashes | Injury Crashes | Property Damage Only |
|---|---|---|---|
| 1998 | 288 | 13,000 | 40,000 |
| 1999 | 313 | 14,000 | 48,000 |
| 2000 | 323 | 13,000 | 42,000 |
| 2001 | 289 | 11,000 | 42,000 |
| 2002 | 274 | 13,000 | 45,000 |
| 2003 | 288 | 14,000 | 44,000 |
| 2004 | 276 | 13,000 | 39,000 |
| 2005 | 278 | 12,000 | 38,000 |
| 2006 | 303 | 11,000 | 41,000 |
| 2007 | 280 | 11,000 | 45,000 |
| 2008 | 251 | 11,000 | 48,000 |
| 2009 | 221 | 9,000 | 47,000 |
| 2010 | 247 | 12,000 | 42,000 |
| 2011 | 243 | 13,000 | 43,000 |
| 2012 | 252 | 12,000 | 42,000 |
| 2013 | 282 | 18,000 | 48,000 |
| 2014 | 235 | 11,000 | 57,000 |
| 2015 | 259 | 14,000 | 53,000 |
| 2016 | 231 | 16,000 | 51,000 |
| 2017 | 231 | 15,000 | 51,000 |
| 2018 | 230 | 15,000 | 50,000 |
| 2019 | 231 | N/A | N/A |
How many people are killed or injured by buses each year?
From 1998 – 2019, 6,770 people were killed and an estimated 567,000 people were injured in crashes involving bus accidents.
| Year | Fatalities | Injuries |
|---|---|---|
| 1998 | 329 | 30,000 |
| 1999 | 373 | 36,000 |
| 2000 | 357 | 29,000 |
| 2001 | 331 | 25,000 |
| 2002 | 331 | 30,000 |
| 2003 | 337 | 31,000 |
| 2004 | 315 | 29,000 |
| 2005 | 340 | 23,000 |
| 2006 | 337 | 21,000 |
| 2007 | 325 | 24,000 |
| 2008 | 311 | 24,000 |
| 2009 | 254 | 20,000 |
| 2010 | 278 | 27,000 |
| 2011 | 284 | 24,000 |
| 2012 | 282 | 23,000 |
| 2013 | 320 | 38,000 |
| 2014 | 283 | 22,000 |
| 2015 | 297 | 24,000 |
| 2016 | 290 | 35,000 |
| 2017 | 276 | 25,000 |
| 2018 | 262 | 27,000 |
| 2019 | 258 | N/A |
However, most of those killed and injured are not bus occupants. During this time frame, a little under 10 percent of those killed were passengers on an involved bus, while the remaining deaths were occupants of other vehicles or pedestrians.
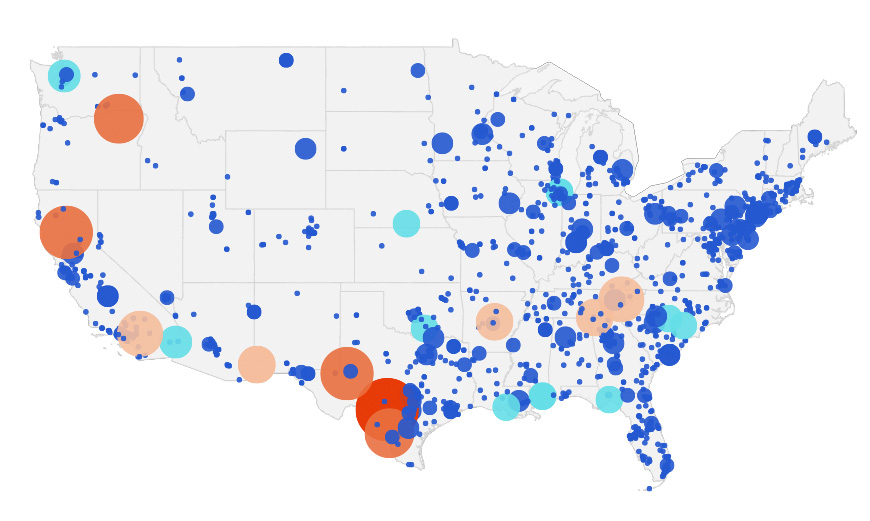
[Interactive Map] Fatal Bus Accidents in the U.S.
While the FMCSA provides general incident data for a larger range of years, it merely provides totals. In order to map data and dive deeper into the issue, we analyzed fatal bus collision data from the National Highway Traffic Safety Administration (NHTSA).
Fatal Bus Crashes by State
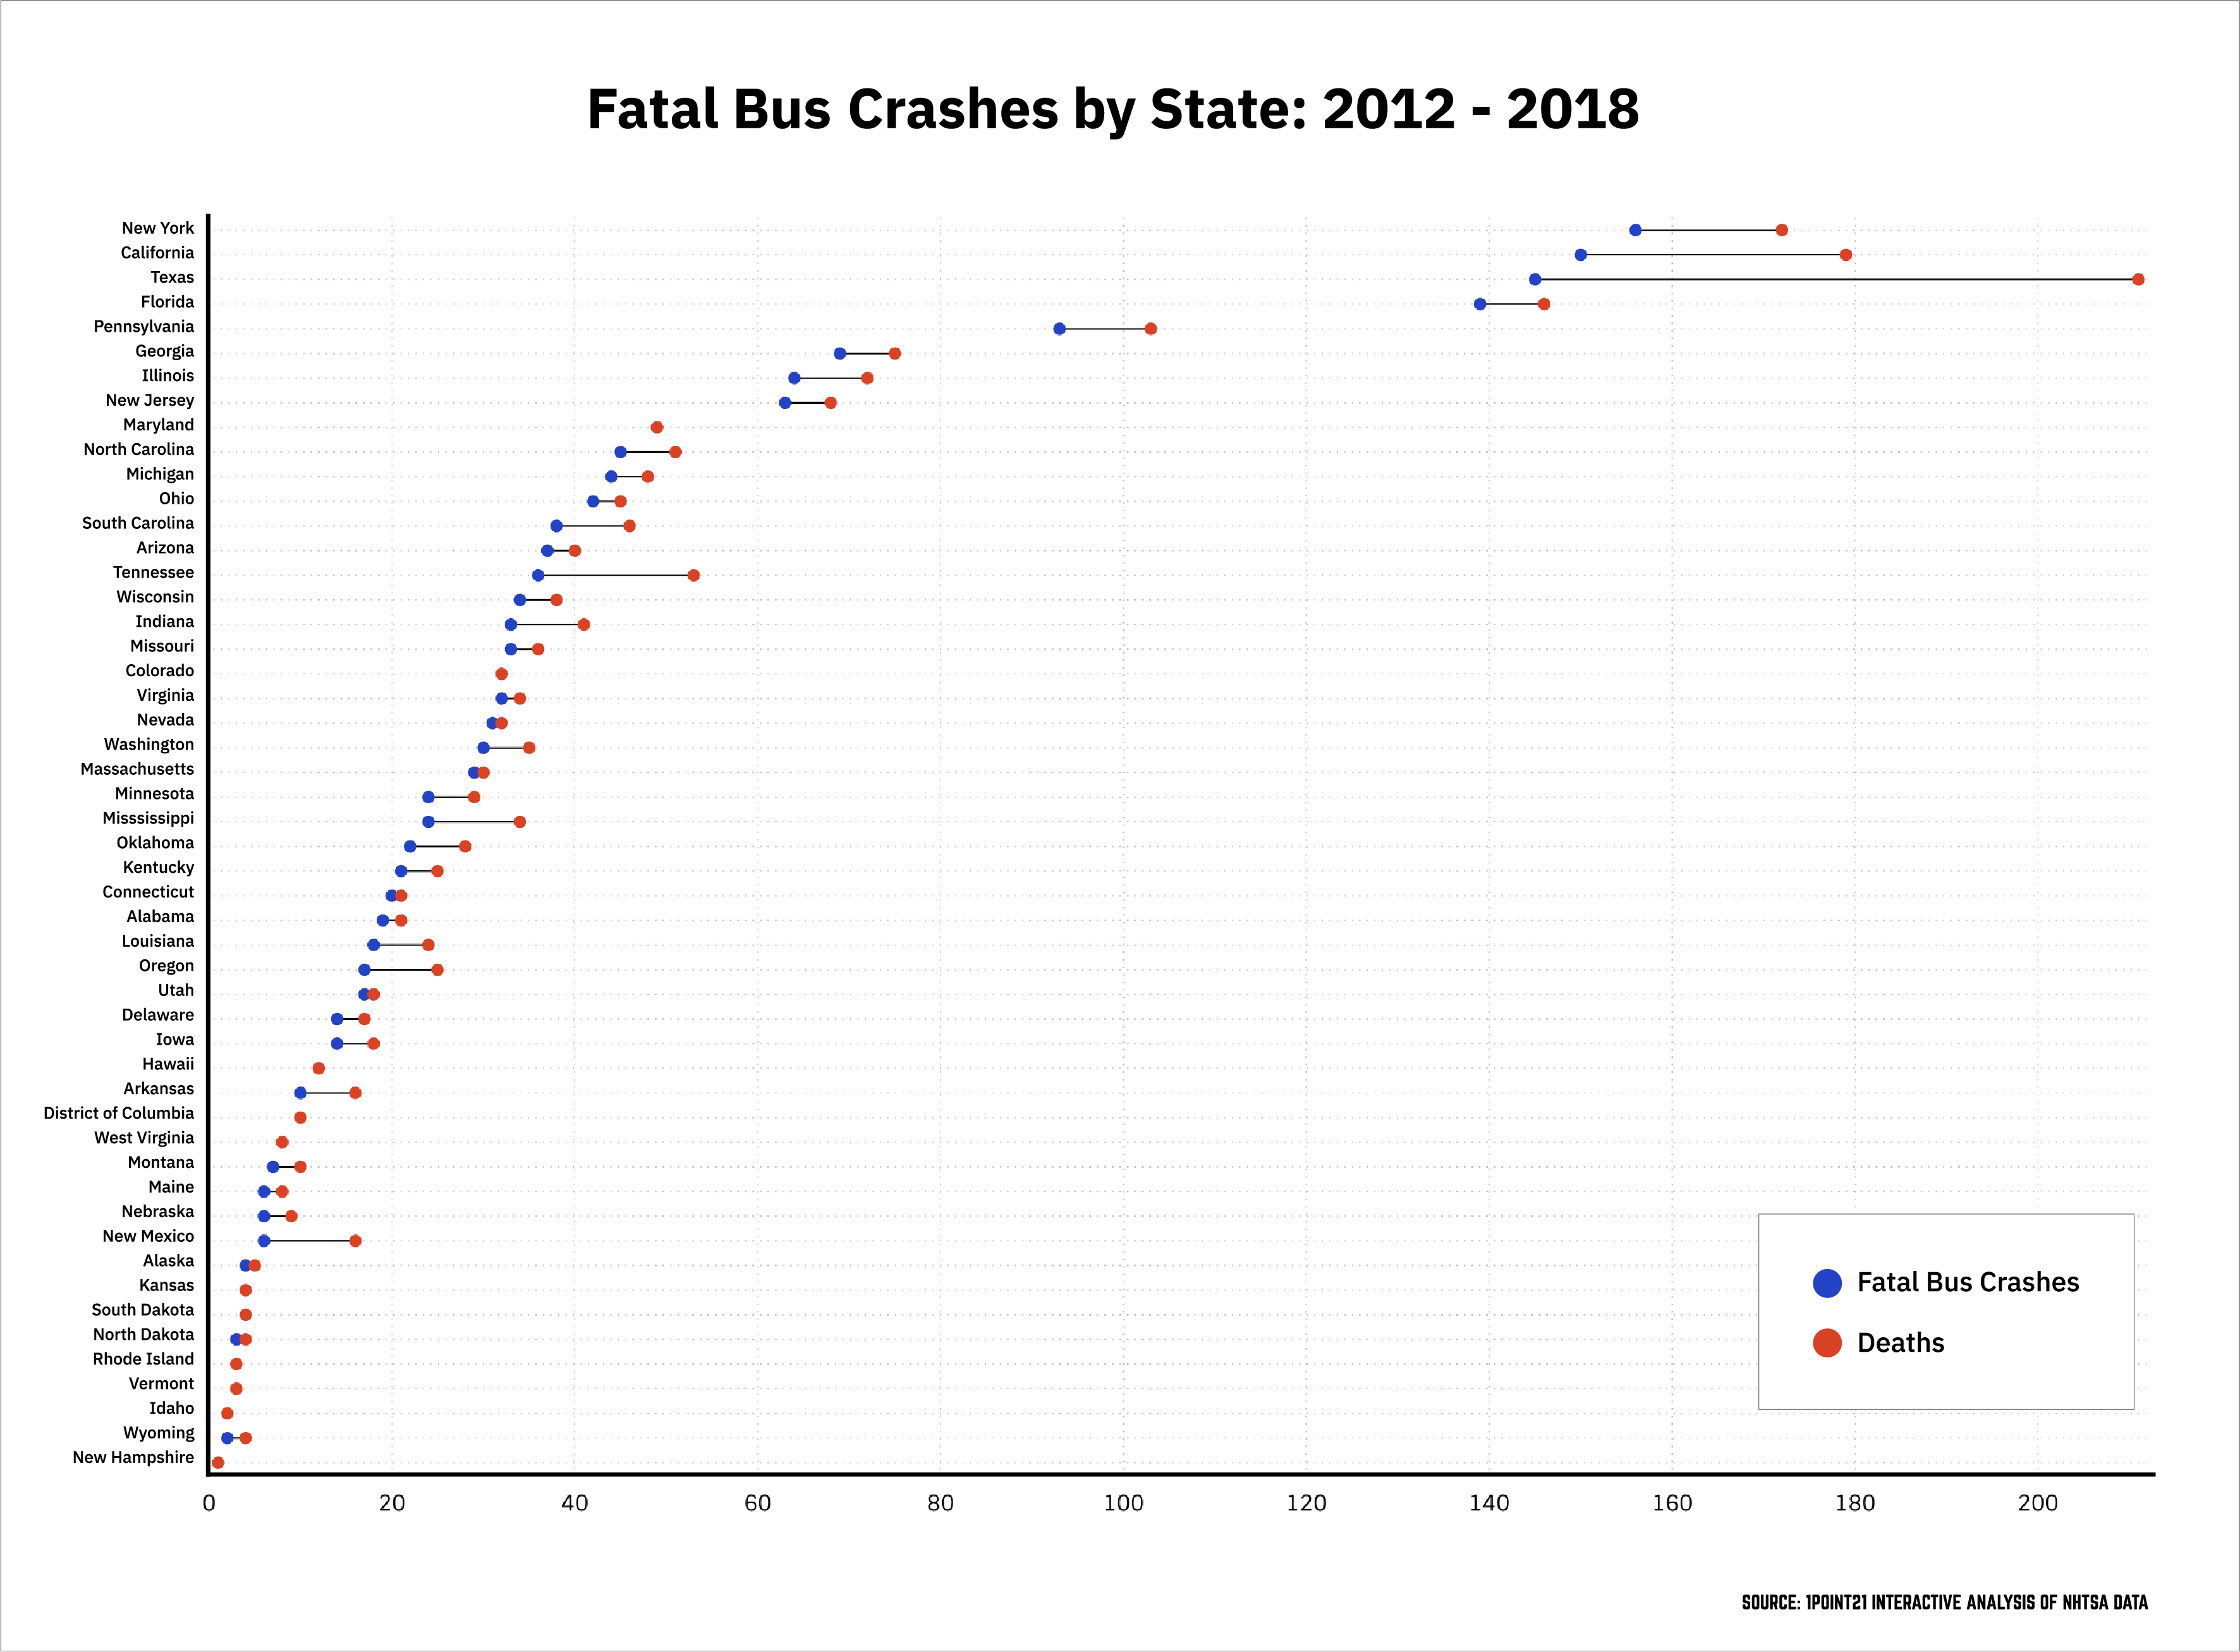
During this time period, more fatal bus crashes occurred in New York (156) than in any other state. This could be, in part, due to the difficulties in navigating New York’s heavy traffic and bustling streets. In 2011, the World Wide Tours bus crash killed 15 passengers and injured 17 more on a highway in the Bronx, New York area. The bus was moving at high speed when it swerved off the road, flipped on its side, and struck a metal sign, which sliced through the length of the bus at the passenger seat level. The 2011 Bronx crash became known as one of the deadliest bus crashes in America. Driver fatigue was determined to be the cause of the crash, and World Wide Tours was responsible for “inadequate safety oversight.”

California, (150), Texas (145), and Florida (139) follow New York with the most fatal bus crashes and also have some of the largest metropolitan areas in the U.S. In 2018, a truck driver lost control of his vehicle and crashed into a church bus in south Texas, killing the bus driver and 12 of the 13 passengers in the bus. The truck driver had been impaired by marijuana, combined with the misuse of prescription drugs used to treat seizures and panic disorders.
| State | Fatal Bus Crashes | Deaths |
|---|---|---|
| New York | 156 | 172 |
| California | 150 | 179 |
| Texas | 145 | 211 |
| Florida | 139 | 146 |
| Pennsylvania | 93 | 103 |
| Georgia | 69 | 75 |
| Illinois | 64 | 72 |
| New Jersey | 63 | 68 |
| Maryland | 49 | 49 |
| North Carolina | 45 | 51 |
| Michigan | 44 | 48 |
| Ohio | 42 | 45 |
| South Carolina | 38 | 46 |
| Arizona | 37 | 40 |
| Tennessee | 36 | 53 |
| Wisconsin | 34 | 38 |
| Indiana | 33 | 41 |
| Missouri | 33 | 36 |
| Colorado | 32 | 32 |
| Virginia | 32 | 34 |
| Nevada | 31 | 32 |
| Washington | 30 | 35 |
| Massachusetts | 29 | 30 |
| Minnesota | 24 | 29 |
| Mississippi | 24 | 34 |
| Oklahoma | 22 | 28 |
| Kentucky | 21 | 25 |
| Connecticut | 20 | 21 |
| Alabama | 19 | 21 |
| Louisiana | 18 | 24 |
| Oregon | 17 | 25 |
| Utah | 17 | 18 |
| Delaware | 14 | 17 |
| Iowa | 14 | 18 |
| Hawaii | 12 | 12 |
| Arkansas | 10 | 16 |
| District Of Columbia | 10 | 10 |
| West Virginia | 8 | 8 |
| Montana | 7 | 10 |
| Maine | 6 | 8 |
| Nebraska | 6 | 9 |
| New Mexico | 6 | 16 |
| Alaska | 4 | 5 |
| Kansas | 4 | 4 |
| South Dakota | 4 | 4 |
| North Dakota | 3 | 4 |
| Rhode Island | 3 | 3 |
| Vermont | 3 | 3 |
| Idaho | 2 | 2 |
| Wyoming | 2 | 4 |
| New Hampshire | 1 | 1 |
Which Bus Type is Involved in the most Fatal Collisions?
While fatal crashes involving buses of any kind have fallen sharply since 1975, some types of buses are more likely to be involved in a fatal crash than others. School buses and transit buses are most likely to be involved in fatal collisions.
From 1975 through 2019, 4,702 school buses and 4,702 transit buses were involved in fatal crashes in the United States.
| Year | School Bus | Motorcoach | Transit Bus | Van-Based Bus | Other Bus Type | Bus Type Unknown |
|---|---|---|---|---|---|---|
| 1975 | 130 | 29 | 131 | — | 18 | 19 |
| 1976 | 123 | 30 | 130 | — | 13 | 23 |
| 1977 | 126 | 33 | 123 | — | 14 | 25 |
| 1978 | 143 | 54 | 143 | — | 14 | 18 |
| 1979 | 150 | 37 | 123 | — | 21 | 16 |
| 1980 | 117 | 38 | 150 | — | 14 | 11 |
| 1981 | 110 | 48 | 150 | — | 20 | 14 |
| 1982 | 104 | 37 | 106 | — | 31 | 11 |
| 1983 | 99 | 41 | 105 | — | 40 | 22 |
| 1984 | 119 | 48 | 103 | — | 33 | 17 |
| 1985 | 126 | 29 | 116 | — | 33 | 33 |
| 1986 | 101 | 33 | 99 | — | 29 | 24 |
| 1987 | 132 | 29 | 115 | — | 46 | 31 |
| 1988 | 105 | 31 | 103 | — | 30 | 18 |
| 1989 | 109 | 32 | 120 | — | 25 | 25 |
| 1990 | 112 | 27 | 114 | — | 19 | 17 |
| 1991 | 106 | 39 | 86 | — | 26 | 17 |
| 1992 | 98 | 36 | 113 | — | 21 | 17 |
| 1993 | 112 | 28 | 82 | — | 21 | 20 |
| 1994 | 106 | 23 | 105 | — | 12 | 12 |
| 1995 | 109 | 23 | 101 | — | 23 | 15 |
| 1996 | 124 | 35 | 115 | — | 32 | 20 |
| 1997 | 117 | 37 | 109 | — | 15 | 19 |
| 1998 | 112 | 38 | 115 | — | 16 | 8 |
| 1999 | 139 | 38 | 106 | — | 19 | 17 |
| 2000 | 120 | 40 | 128 | — | 20 | 17 |
| 2001 | 119 | 38 | 104 | — | 16 | 15 |
| 2002 | 95 | 35 | 100 | — | 26 | 18 |
| 2003 | 113 | 26 | 104 | — | 30 | 18 |
| 2004 | 111 | 35 | 85 | — | 26 | 22 |
| 2005 | 111 | 38 | 83 | — | 34 | 14 |
| 2006 | 118 | 33 | 105 | — | 22 | 27 |
| 2007 | 109 | 35 | 113 | — | 16 | 8 |
| 2008 | 116 | 20 | 92 | — | 12 | 11 |
| 2009 | 89 | 38 | 77 | — | 9 | 8 |
| 2010 | 116 | 36 | 84 | — | 11 | 4 |
| 2011 | 98 | 41 | 68 | 25 | 10 | 3 |
| 2012 | 102 | 34 | 78 | 30 | 7 | 2 |
| 2013 | 114 | 44 | 82 | 28 | 10 | 4 |
| 2014 | 91 | 32 | 79 | 9 | 21 | 4 |
| 2015 | 99 | 34 | 93 | 14 | 18 | 5 |
| 2016 | 88 | 17 | 98 | 6 | 19 | 6 |
| 2017 | 73 | 13 | 97 | 31 | 16 | 4 |
| 2018 | 85 | 15 | 85 | 26 | 20 | 3 |
| 2019 | 89 | 5 | 84 | – | 46 | 8 |
Causes and General Bus Safety Tips
Potential causes of bus crashes can include faulty bus equipment, company policies and regulations, roadway and weather conditions, and driver-related problems such as distracted driving or driving under the influence. One of the most significant causes is driver fatigue when a driver’s performance and senses are impaired from mental or physical exhaustion and sleep deprivation. Driving fatigued increases the risk of crashing, and is especially common for bus drivers traveling longer distances or operating on tight schedules. Buses are harder to control, which can cause other drivers to enter into their lane prematurely or rear-end the bus. While buses are generally safe and have regulations and designs in place to increase passenger safety, preventable crashes occur every year as a result of driver error.
Whether you are sharing the road with a bus or driving one, keep these tips in mind to increase safety:
- Don’t tailgate a bus; always keep a considerable distance between vehicles when you are driving behind a bus. There is less visibility behind a bus, and that makes it difficult to brake in time.
- Recognize warning signs of fatigue and don’t brush them off. Ignoring them will put passengers at a risk, as well as others on the road.
- Follow the speed limit, and choose caution over impatience.
- Categories:
- Maps

