This post originally appeared on: https://www.walkuplawoffice.com/2021/11/17/study-the-most-dangerous-pedestrian-intersections-in-san-francisco/.
On March 31, 2021, a 74-year-old man crossing the intersection at San Bruno and Masson Avenue was struck by a vehicle, and died. On May 18, 2021, a 29-year-old woman was killed in a similar way at the intersection of Hayes and Polk Streets – marking the
eighth pedestrian death this year in San Francisco.
Over the years, San Francisco has earned a reputation as one of the most dangerous cities for pedestrians in the U.S. From 2016-2020, pedestrian crashes made up
more than 25 percent of total crashes. During that time, there were
4,096 pedestrian crashes in the San Francisco area – leaving 77 pedestrians killed and 4,313 more injured.
At Walkup, Melodia, Kelly & Schoenberger, we identify this as a serious issue. In the past, we have worked with
1Point21 Interactive to explore various traffic safety issues involving
pedestrians and
bicyclists.
In this analysis, we identified two types of pedestrian risk:
1. Areas where pedestrian crashes are most likely to occur.
2. Areas where individual pedestrians are most likely to be stuck and injured.
Essentially, we found areas where ANY pedestrian is most likely to be struck and areas where YOU are most likely to be struck if you cross a street.
Key Findings
- Arleta Avenue & San Bruno Avenue is the most dangerous intersection in San Francisco, based on both metrics. It is the only intersection to appear in the top ten for both total pedestrian crashes AND collisions per 1 million pedestrian crossings.
- In total, only four intersections ranked in the top 20 for both metrics. These may be the most dangerous crossings in all of San Francisco: Arleta Avenue & San Bruno (as previously mentioned), San Bruno Avenue & Woolsey Street, Sickles Avenue & Alemany Boulevard, and Halloway Avenue & Junipero Serra.
- Pedestrian crashes are much more likely to occur in inner-city neighborhoods, the Tenderloin, SOMA, Mission, and Downtown specifically.
- However, on a per crossing basis, individual pedestrians are at a higher risk of being struck by vehicles in the less dense, more residential areas such as Corona Heights, Candlestick Point, St. Mary’s Park and Diamond Heights.
- Pedestrian crashes are most likely to be caused by a driver’s error, not a pedestrian’s.
What Causes Most Pedestrian Crashes in San Francisco?
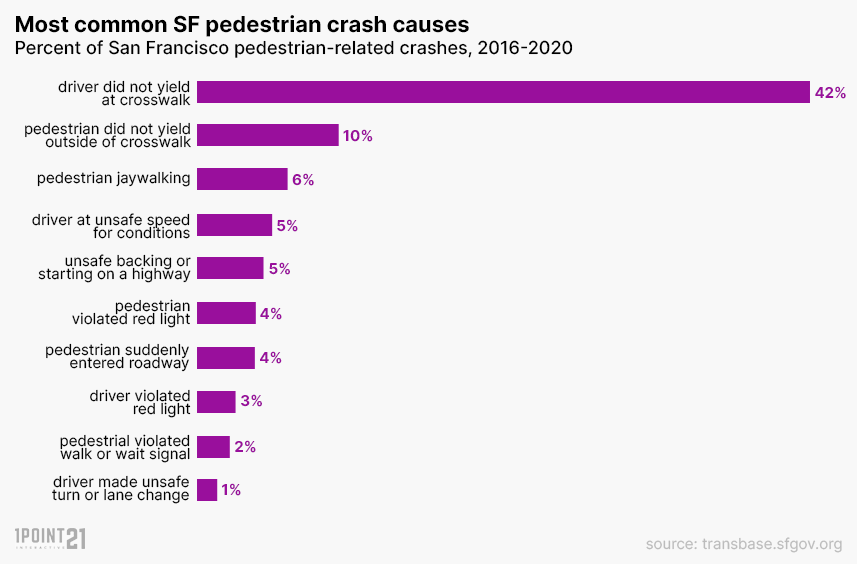
As you might expect, most pedestrian crashes in San Francisco are a result of driver error. During the study period, drivers were found to be at fault in
59 percent of San Francisco pedestrian crashes, compared to only 28 percent where the pedestrian was at fault. More specifically, a driver failing to yield the right of way to a pedestrian at a crosswalk was the primary cause of more than 42 percent of pedestrian collisions. Use caution when using crosswalks.
Where Are Pedestrian Crashes Most Likely to Occur?
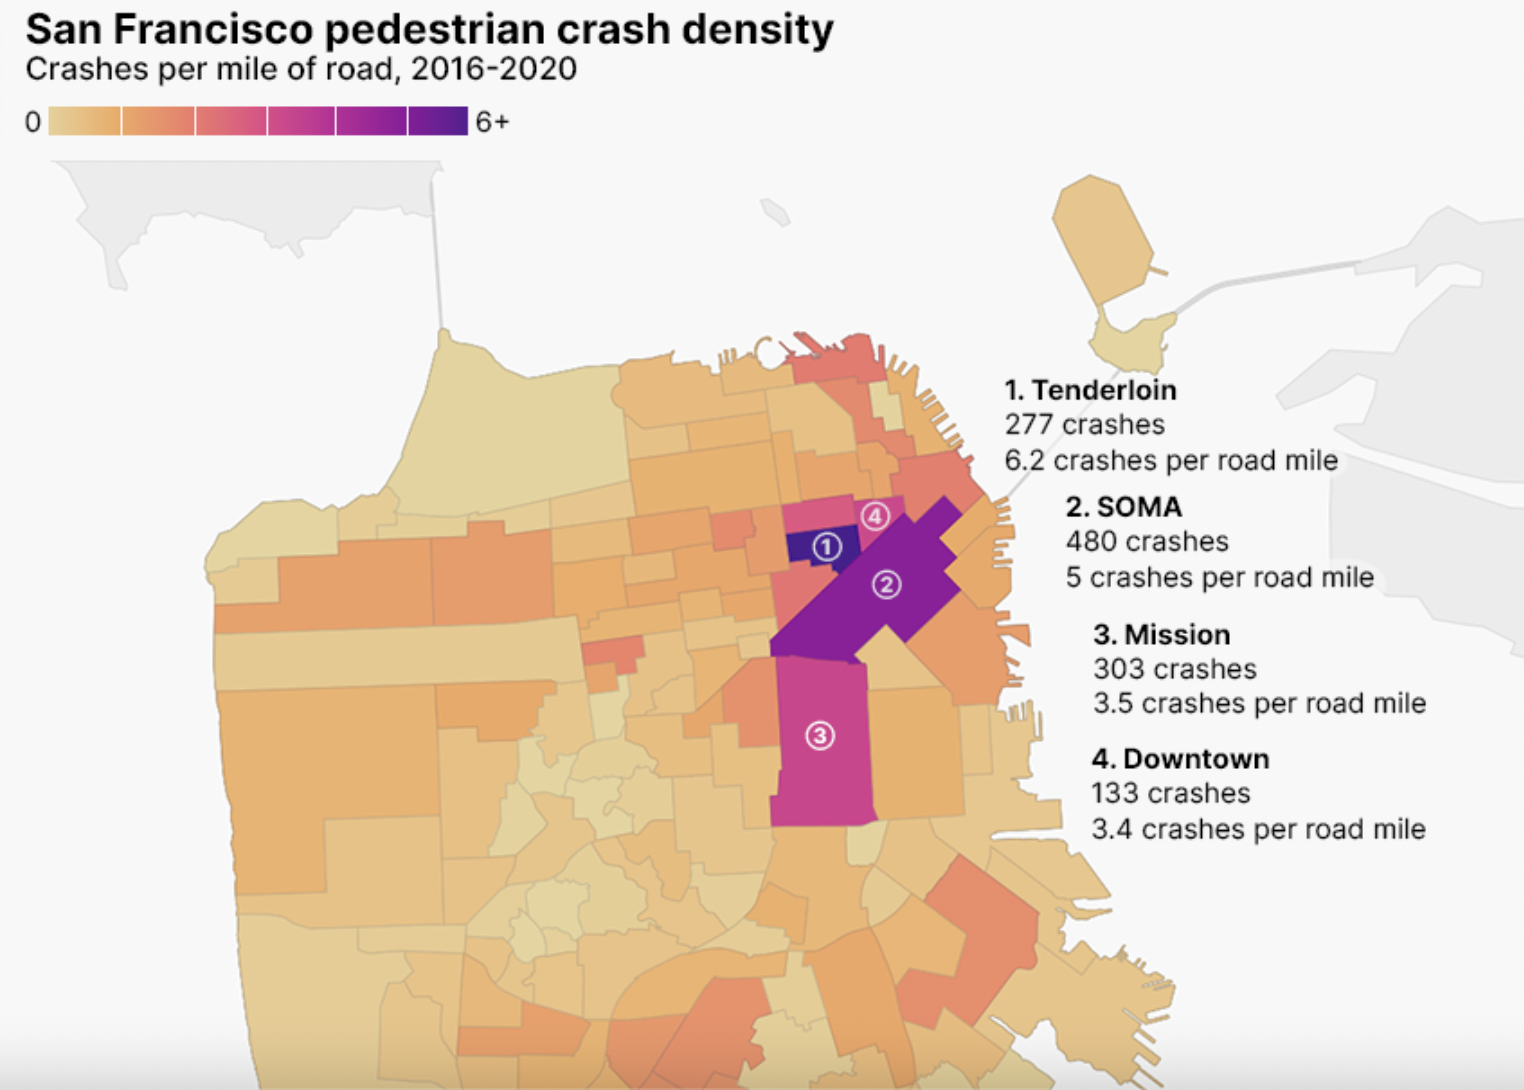
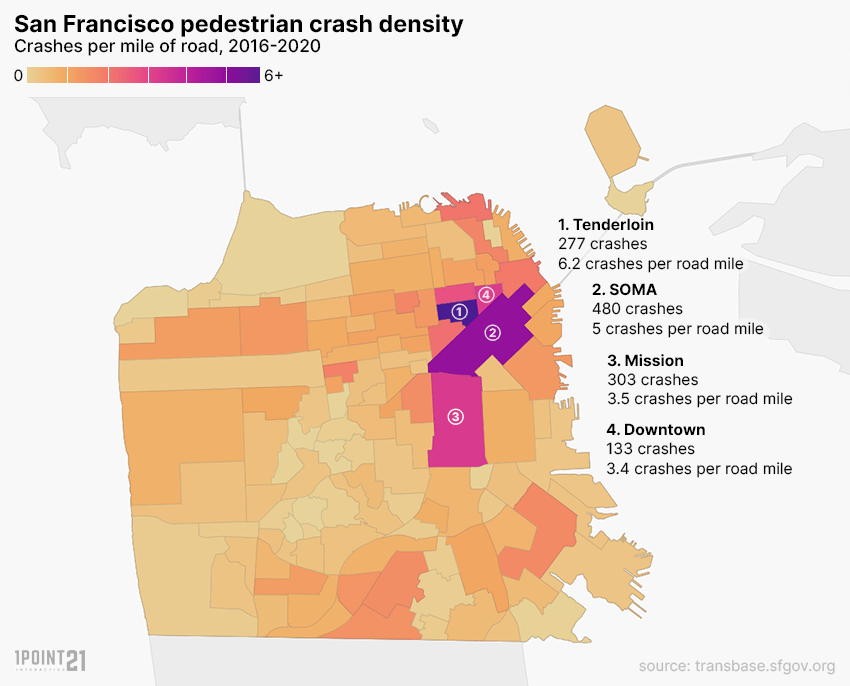
As outlined in our key findings section, pedestrian collisions are most likely to occur in the denser, inner-city areas of San Francisco. Since San Francisco neighborhoods vary in size, we calculated a “crashes per mile of road” in each for an apples-to-apples comparison. By this metric, the Tenderloin is the most dangerous neighborhood for pedestrians in San Francisco – there are more crashes per road mile here than any other neighborhood in San Francisco. In fact, there have been 6.2 pedestrian-involved crashes on any given mile of roadway in this neighborhood since 2016. That translates to about one crash every three blocks.
Neighborhoods Where a Pedestrian Crash Is Most Likely to Occur
1. The Tenderloin – 277 pedestrian crashes, 6.2 crashes per road mile
2. South of Market (SoMa) – 480 pedestrian crashes, 5 crashes per road mile
3. Inner Mission – 303 pedestrian crashes, 3.5 crashes per road mile
4. Downtown – 133 pedestrian crashes, 3.4 crashes per road mile
High Pedestrian Collision Intersections
Given that driver crosswalk violations are the most common cause of pedestrian collisions, which intersections are pedestrians stuck most often? Just as in the neighborhood analysis, the intersections where a pedestrian collision is most likely to occur aggregated in the denser areas of the city (with the exception of one).
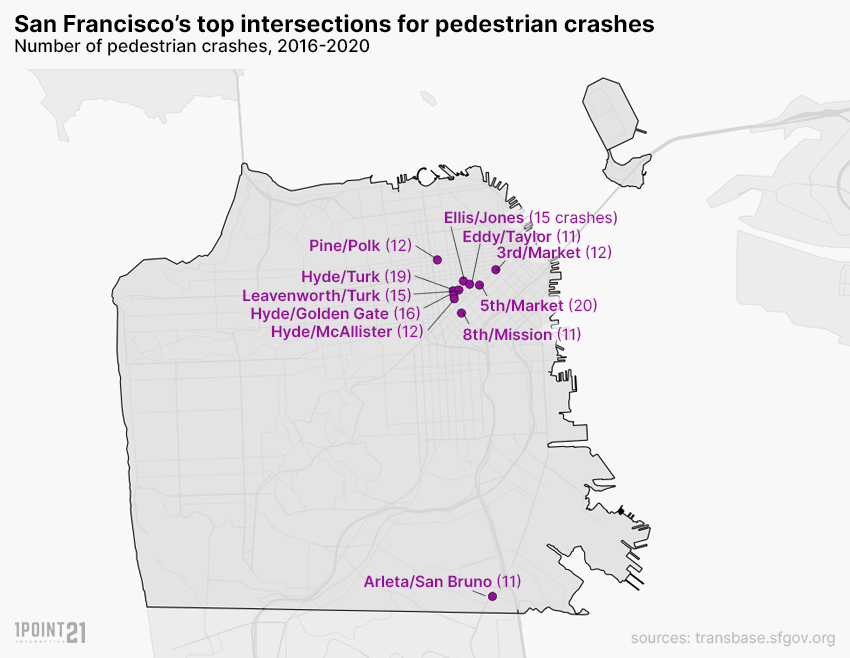
From 2016-2020, the highest number of pedestrian crashes occurred at the intersections of 5th Street & Market Street (20 crashes) and Hyde Street & Turk St (19 crashes).
| Rank |
Intersection |
Crashes |
Fatalities |
Injuries |
Percent Pedestrian * |
| 1 |
5th St & Market St |
20 |
0 |
21 |
59% |
| 2 |
Hyde St & Turk St |
19 |
0 |
20 |
90% |
| 3 |
Golden Gate Ave & Hyde St |
16 |
1 |
18 |
70% |
| 4 |
Jones St & Ellis St |
15 |
1 |
15 |
79% |
| 5 |
Leavenworth St & Turk St |
15 |
0 |
15 |
71% |
| 6 |
3rd St & Market St |
12 |
0 |
14 |
55% |
| 7 |
Hyde St & Mcallister St |
12 |
0 |
14 |
50% |
| 8 |
Pine St & Polk St |
12 |
0 |
13 |
67% |
| 9 |
Eddy St & Taylor St |
11 |
0 |
13 |
85% |
| 10 |
Arleta Ave & San Bruno Ave |
11 |
0 |
12 |
85% |
| 11 |
Mission St & 8th St |
11 |
0 |
11 |
38% |
*Percent pedestrian is the percentage of all motor vehicle crashes at that intersection that involved a pedestrian.
**Ties in total crashes were broken by Percent Pedestrian, then Injuries.
Many of these intersections are particularly concerning, as pedestrian collisions make up a significant percentage of all crashes. For instance, 90 percent of motor vehicle crashes at Hyde Street & Turk Street involved pedestrians.
Examining Crash Risk to Individual Pedestrians
We have established where pedestrian
collisions are most likely to occur, but these neighborhoods and intersections are located in very busy, high-volume pedestrian areas. Where then, are individual pedestrians at the highest risk of being struck? By this, we mean, which neighborhoods and intersections would
you be most likely to be hit crossing the street?
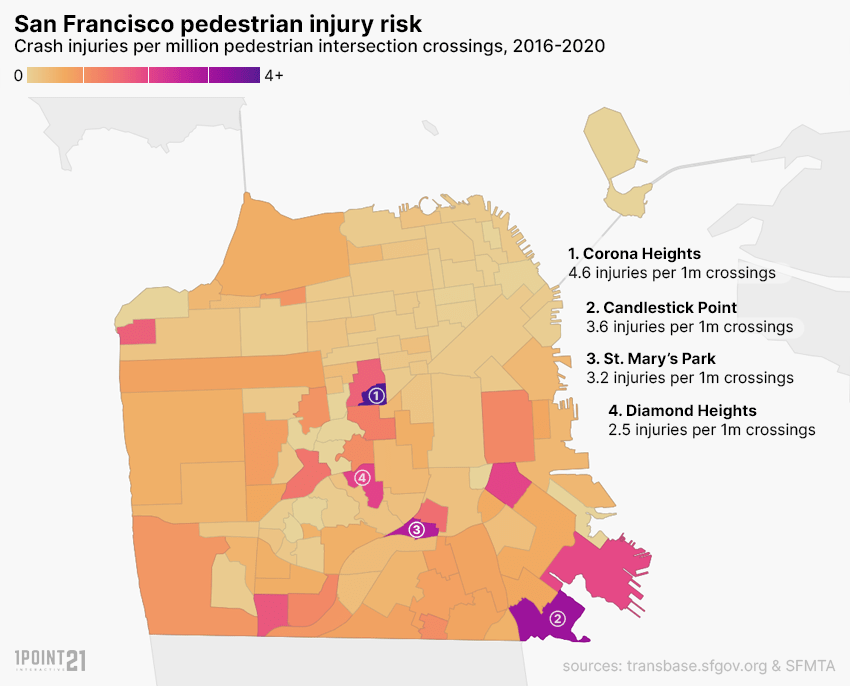
This map shows the number of pedestrian injuries incurred for every million street crossings. It reflects how likely
you are, as a pedestrian, to be struck and injured crossing a particular intersection, while the prior chart (“San Francisco pedestrian crash density”) reflected how likely it was that
someone would get hit in a general area. We can see here that the risk to individual pedestrians shifts away from the inner city and towards less dense, more residential neighborhoods.
Neighborhoods with the highest risk of collision injury to each individual pedestrian:
1. Corona Heights – 4.6 injuries per 1 million crossings
2. Candlestick Point – 3.6 injuries per 1 million crossings
3. St. Mary’s Park – 3.2 injuries per 1 million crossings
4. Diamond Heights – 2.5 injuries per 1 million crossings
When looking at data for specific intersections, the same trend becomes apparent.
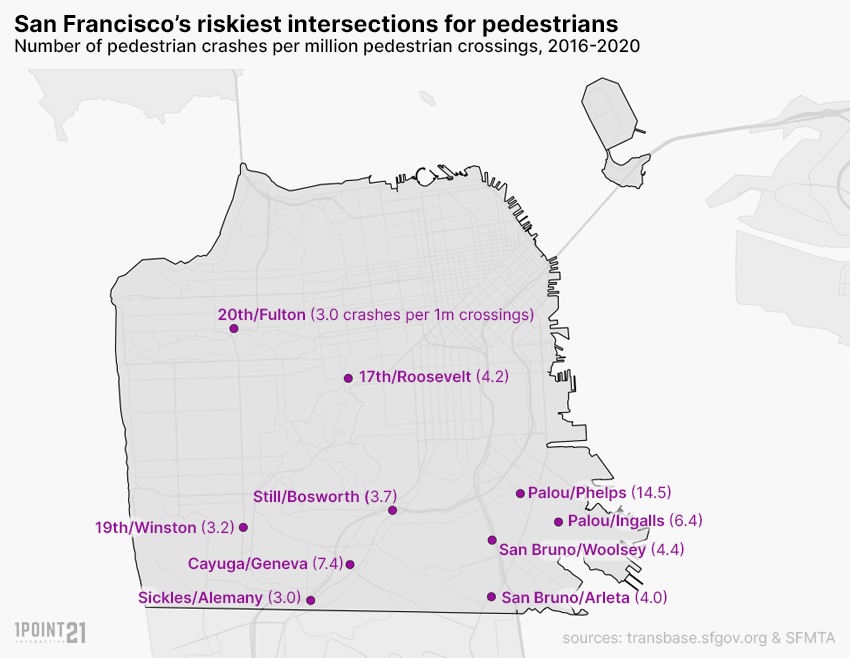
Intersections with the Highest Individual Pedestrian Risk
| Intersection |
Crashes |
Injuries |
Annual Ped Volume |
Crashes per 1m |
| Palou Ave & Phelps St |
2 |
2 |
27,654 |
14.5 |
| Cayuga Ave & Geneva Ave |
3 |
8 |
216,733 |
7.4 |
| Ingalls St & Palou Ave |
2 |
4 |
124,385 |
6.4 |
| San Bruno Ave & Woolsey St |
5 |
8 |
366,690 |
4.4 |
| 17th St & Roosevelt Way |
3 |
3 |
141,363 |
4.2 |
| San Bruno Ave & Arleta Ave |
11 |
12 |
604,258 |
4 |
| Still St & Bosworth St |
2 |
3 |
162,549 |
3.7 |
| 19th Ave & Winston Dr |
4 |
4 |
252,345 |
3.2 |
| Sickles Ave & Alemany Blvd |
5 |
5 |
332,892 |
3 |
| Fulton St & 20th Ave |
4 |
4 |
266,802 |
3 |
Putting it All Together: The Four Most Dangerous Intersections in San Francisco
When comparing the two metrics: total pedestrian crashes and pedestrian crashes per million crossings, only four were in the top 20 for both.
1. Arleta Avenue & San Bruno Avenue: 11 crashes – 4.0 crashes per 1 million crossings
2. San Bruno Avenue & Woolsey Street: 5 crashes – 4.4 crashes per 1 million crossings
3. Sickles Avenue & Alemany Boulevard: 5 crashes – 3.0 crashes per 1 million crossings
4. Holloway Avenue & Junipero Serra Boulevard: 5 crashes – 2.6 crashes per 1 million crossings
While five crashes may not seem like a lot, it is very rare that an intersection ever sees a pedestrian collision. However, the four listed above were well above the average for both metrics.
Arleta & San Bruno, our most dangerous intersection saw more than 5 times the average number of crashes and nearly 8 times the number of crashes per 1 million pedestrian crossings.
Improving Safety for Pedestrians
This analysis makes one thing clear: Pedestrian safety isn’t where it needs to be and the city is more than aware of this. Currently, there are several citywide efforts and multiple projects in progress to improve roadway safety:
- In 2017, the San Francisco Municipal Transportation Agency (SFMTA) wrapped up the first phase of the San Bruno Avenue Multimodal Improvement Project – aimed to improve transit, pedestrian safety, and parking modifications. In 2019, the project added sidewalk extensions, street corner extensions for pedestrian visibility, and a new traffic signal to improve service. While the project is complete, the city is continuing to explore new options.
- A project called “Safer Taylor Street” is focusing on improving safety in the Tenderloin neighborhood, where most pedestrian crashes occur.
- In March 2021, the Tenderloin also became the first neighborhood in San Francisco with widespread speed limit reductions.
- SFMTA also launched a “Be Nice, Look Twice” campaign, which advises drivers to drive like their friend or mom is in the crosswalk, to slow down in speed, always yield to pedestrians, and take left turns carefully.
Data, Methodology & Fair Use
Collision data was sourced from the San Francisco Municipal Transporation Agency’s TransBASE open data project and covers the full years of 2016 – 2020. Pedestrian volume data was sourced from a study by the San Francisco Municipal Transportation Agency.
For more information about our data and methodology, please contact us.
If you would like to report on or share the results of our study, including the maps and images, please provide attribution by linking to this page. Interviews are available upon request.


 From 2016-2020, the highest number of pedestrian crashes occurred at the intersections of 5th Street & Market Street (20 crashes) and Hyde Street & Turk St (19 crashes).
 This map shows the number of pedestrian injuries incurred for every million street crossings. It reflects how likely you are, as a pedestrian, to be struck and injured crossing a particular intersection, while the prior chart (“San Francisco pedestrian crash density”) reflected how likely it was that someone would get hit in a general area. We can see here that the risk to individual pedestrians shifts away from the inner city and towards less dense, more residential neighborhoods.
Neighborhoods with the highest risk of collision injury to each individual pedestrian:
1. Corona Heights – 4.6 injuries per 1 million crossings
2. Candlestick Point – 3.6 injuries per 1 million crossings
3. St. Mary’s Park – 3.2 injuries per 1 million crossings
4. Diamond Heights – 2.5 injuries per 1 million crossings
When looking at data for specific intersections, the same trend becomes apparent.


