[Study] The Impact of the Super Bowl on U.S. Fatal Crashes
This post originally appeared on: https://ellisinjurylaw.com/super-bowl-crash-study/.
The Super Bowl is more than the NFL championship game, it’s a cultural phenomenon. It’s one of the most-watched television events each year and millions of people across the United States either throw or attend watch parties on Super Bowl Sunday. However, these parties are often synonymous with heavy drinking. So much so, that some estimates have found that Americans drink over 300 million gallons of beer on Super Bowl Sunday. It stands to reason that not all those who attend parties will celebrate responsibly. Others may be distracted or inattentive on the road. What impact then, if any, does the Super Bowl have on road safety? We partnered with data visualization company 1Point21 Interactive to investigate. We studied national and state-level data from 2001 – 2019 and compared Super Bowl Sunday to the week immediately preceding and following it. We then divided the time surrounding the big game into five parts:- Day-of: 6 hours before pregame (7:30 am- 1:30 pm PST)
- Pregame: 2 hours before the telecast (1:30-3:30 pm)
- Telecast: the game itself (3:30-7 pm)
- Postgame: 2 hours after telecast (7-9 pm)
- Late night: 6 hours after postgame (9 pm-3 am)
At the National Level:
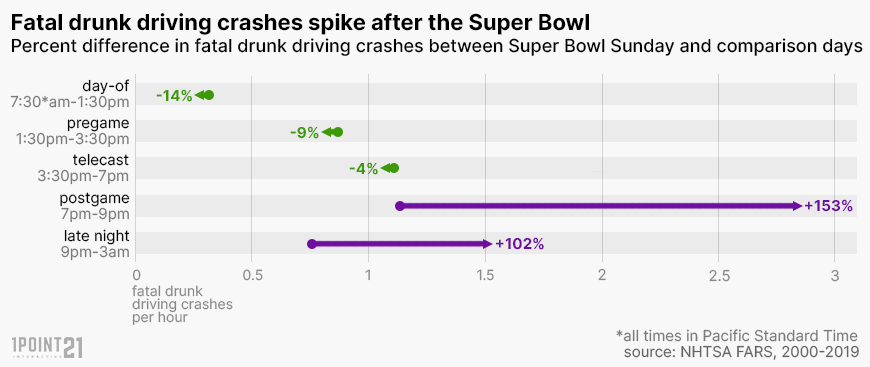
Overall, fatal crashes increase dramatically on Super Bowl Sunday when compared to a typical Sunday. However, the effect varies greatly depending upon the time of the day and, most notably, the game telecast itself. For instance, there is actually an 8 percent decrease in fatal crashes during the Super Bowl. The largest increase occurs once the game ends. The Postgame period, defined as the two hours immediately after the game is over, is the most dangerous time on Super Bowl Sunday. We observed an 82 percent increase in fatal crashes from all sources during this period. In total, there has been a 61 percent increase in fatal crashes following the end of the game through the Late Night Period. 
Alcohol-Related Fatal Crashes
It is clear that the most dangerous time to be on the road is after the game ends. Why? Drunk driving. Fatal crashes involving alcohol increase by 153 percent during the two-hour Postgame period, nearly five times the increase of fatal crashes where alcohol was not a factor (153% vs 36%). 
Who Is At Risk?
Nearly every demographic group experiences a sharp increase in fatal crash risk on Super Bowl Sunday, particularly in the Postgame Period. However, members of certain groups experience greater increases in deaths than others. The chart below shows the relative increase in risk along with the average number of fatal crashes per hour for each group. Interestingly, men and women see very similar risk increases, though more men are killed in fatal collisions. 
- The biggest regional increases happen in states in the Eastern and Central time zones.
- States with a losing Super Bowl team see a 26% increase in fatal crashes during the postgame, but states with a winning team see a 69% decrease. This means that – on average – having a local team represented in the Super Bowl is actually protective – especially if they win.
At the State Level: California Data
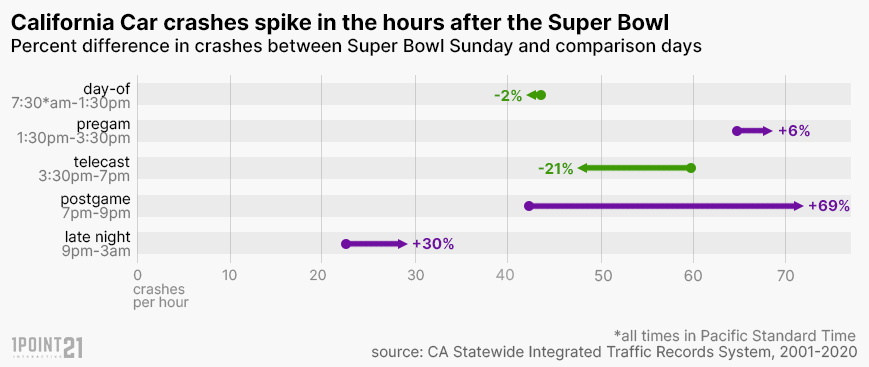
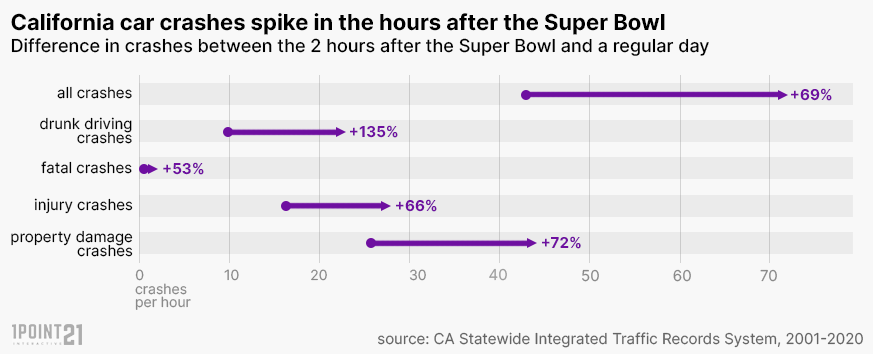
While national-level data clearly shows the significant increase in risk of fatal collisions on Super Bowl Sunday, we felt it was important to investigate the event’s impact on all crashes, not just fatal collisions. Since there is no existing national database that includes collisions of any severity, we chose to use California as a stand-in. After examining California data, we found strikingly similar patterns. Crashes fell during the game, then rose sharply immediately after it was over.  Just as with the national data, the greatest increase occurs in the two-hour Postgame period. In California, all crashes spike dramatically during this time period, of course, led by those involving alcohol. The chart below shows the increase by crash type and number of crashes per hour on average.
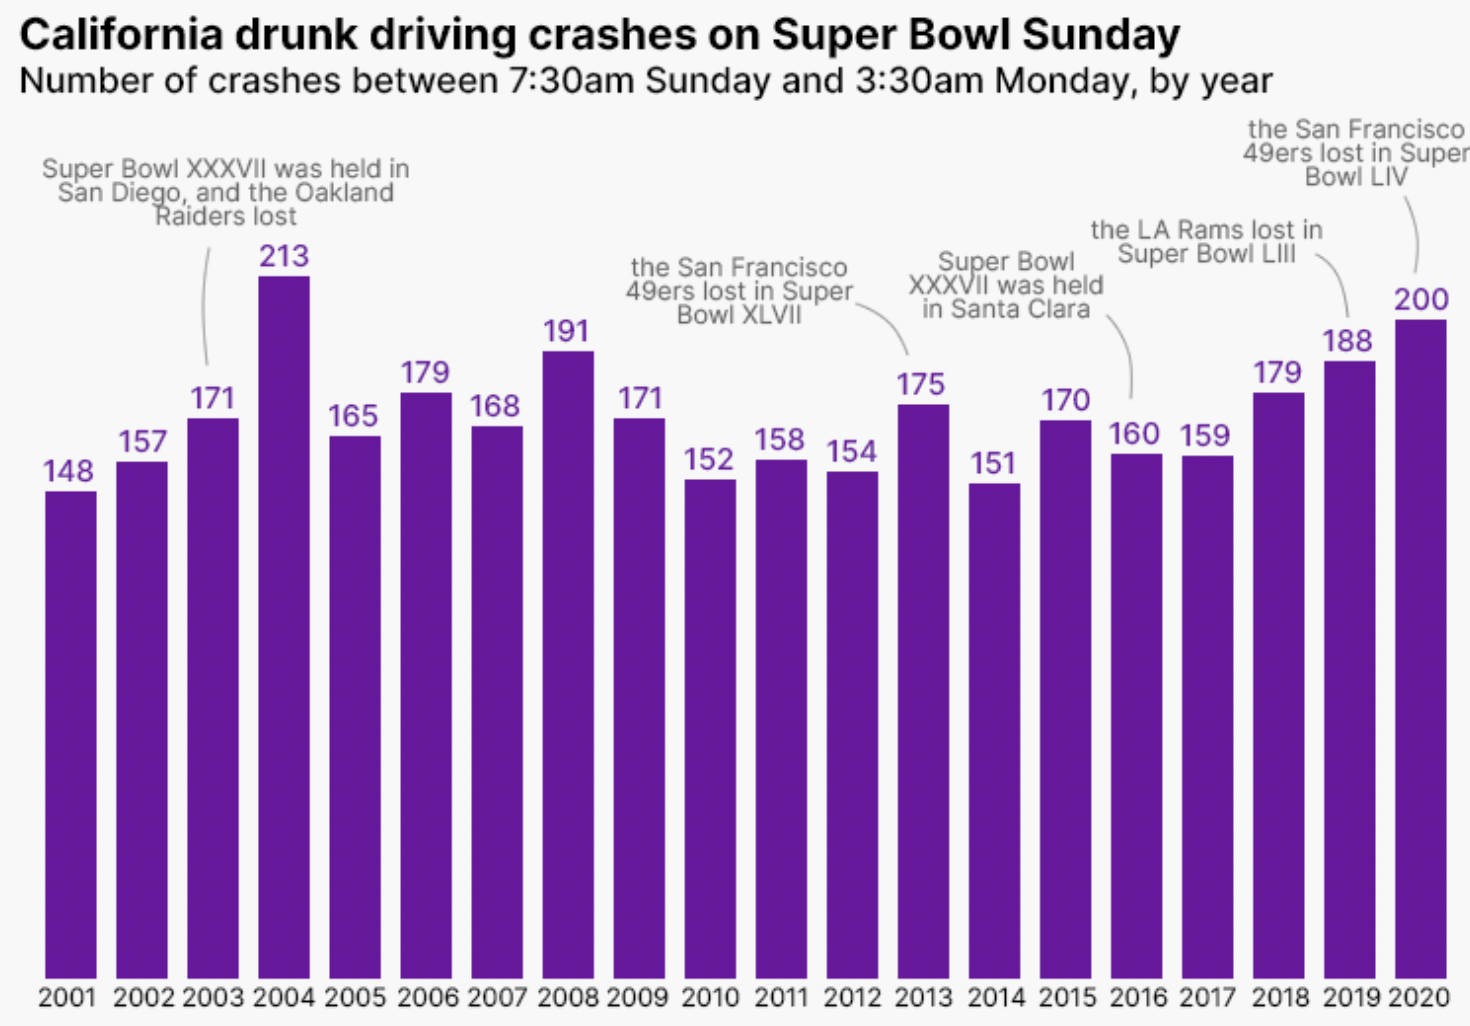
  Interestingly, in years where a California team is involved in a Super Bowl, postgame drunk driving crashes are slightly higher on average – with 184 in years with a California team and 167 with two out-of-state teams. Unfortunately, we were not able to compare the differences between wins and losses as the California team lost in all four appearances during the study period.
Where Do California Crashes Increase the Most?
During the postgame period, the amount of increase in crashes varies from county to county. Those with the largest increase ring the Sacramento metro area.  How are the ten most populous counties affected? (arranged by population size)
- Los Angeles 64% increase
- San Diego 87%
- Orange 83%
- Riverside 62%
- San Bernardino 61%
- Santa Clara 98%
- Alameda 45%
- Sacramento 91%
- Contra Costa 91%
- Fresno 97%
Takeaways: Stay Safe
This year, perhaps more than any other, consider watching the game at home and staying at home after it ends. However, if you plan to watch the big game this year at any location outside your home, take steps to make sure you arrive at your destination safely and make it back home
- Do not drink and drive. If you plan to consume alcohol, make sure to designate a driver or secure a safe, sober ride home.
- Consider staying for two hours after the game ends. The two hours immediately following the Super Bowl is – by far – the most dangerous time to be on the road. Crash risk from all sources drops considerably after.
- Be aware. Make sure to obey all posted traffic signs and signals, drive defensively, and avoid distraction
Data Sources and Fair Use
We analyzed data from both the National Highway Traffic Safety Association and the California Highway Patrol in the study. All times are shown in Pacific Standard Time (PST). If you would like to republish or report on our findings, please link to this page to cite our work. For more information about our methodology or findings, please contact us.
- Categories:
- North America
- Studies

