Study: Motor Vehicle Crashes on Kentucky Derby Weekends
This post originally appeared on: https://justicestartshere.com/kentucky-derby-crash-study/.
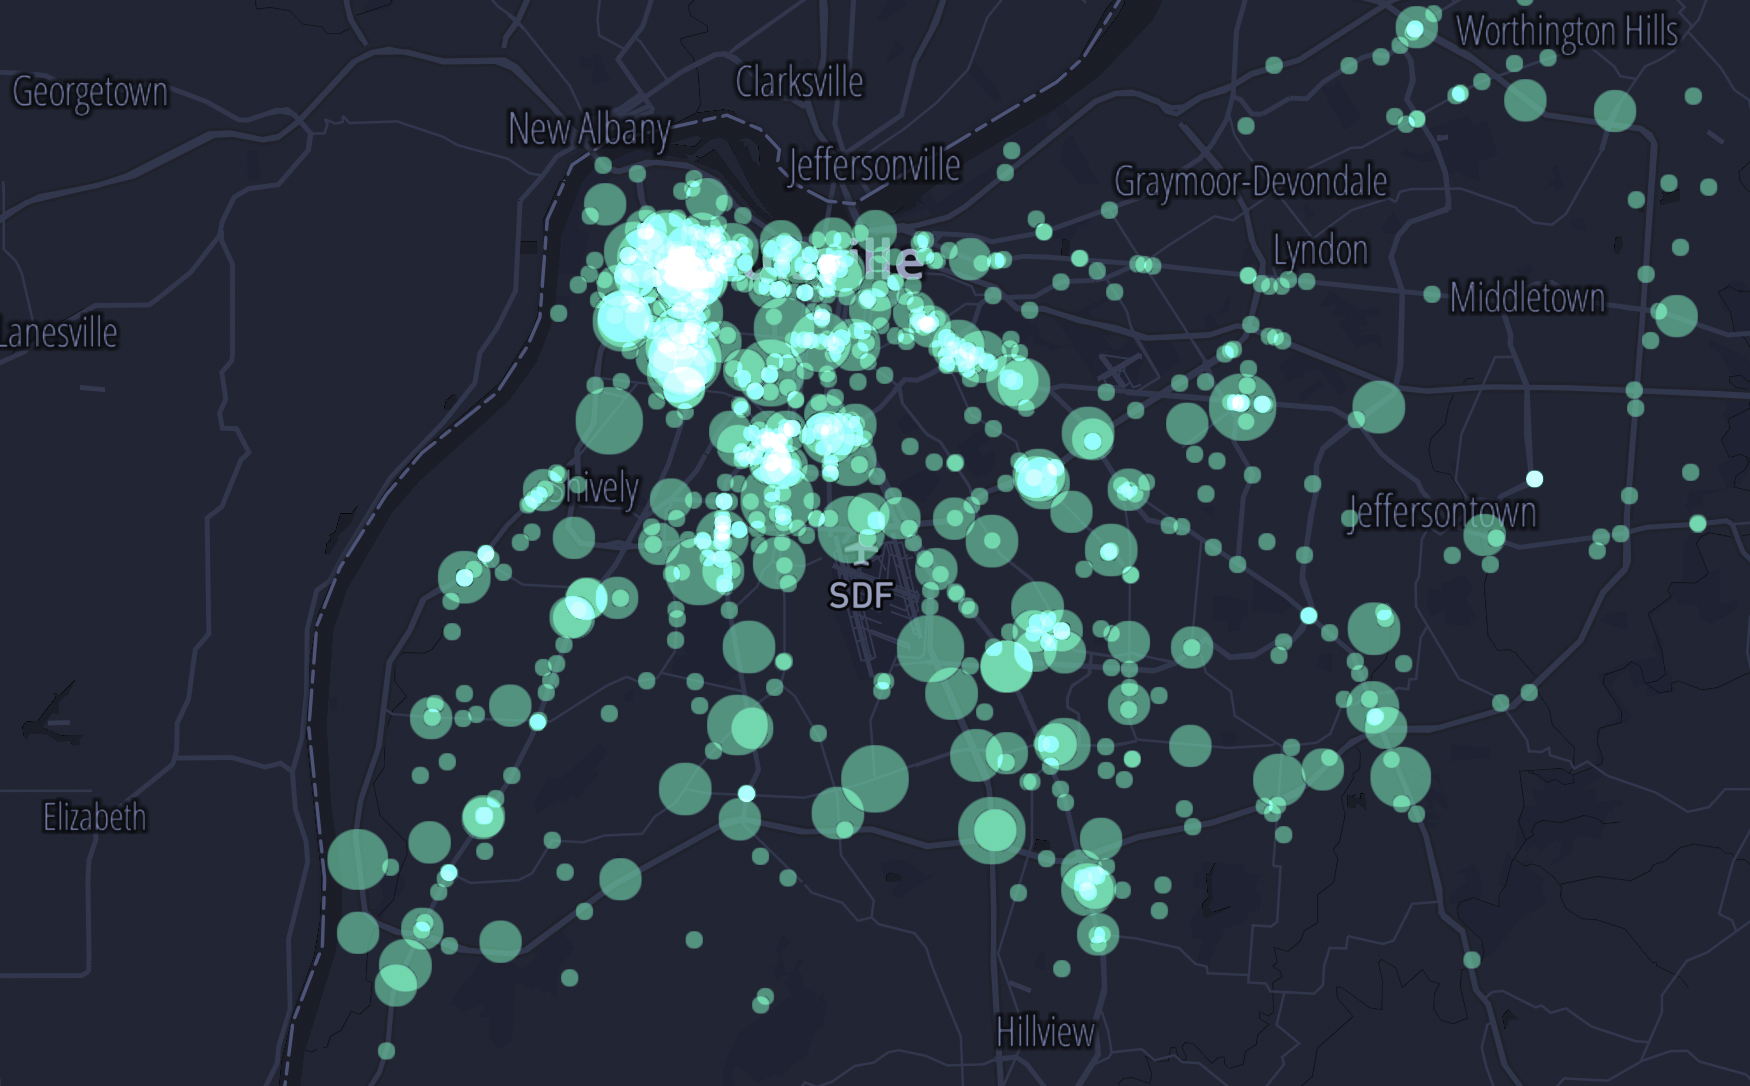
*The map above is interactive and displays all collisions in Lousiville on Kentucky Derby weekend over five years.
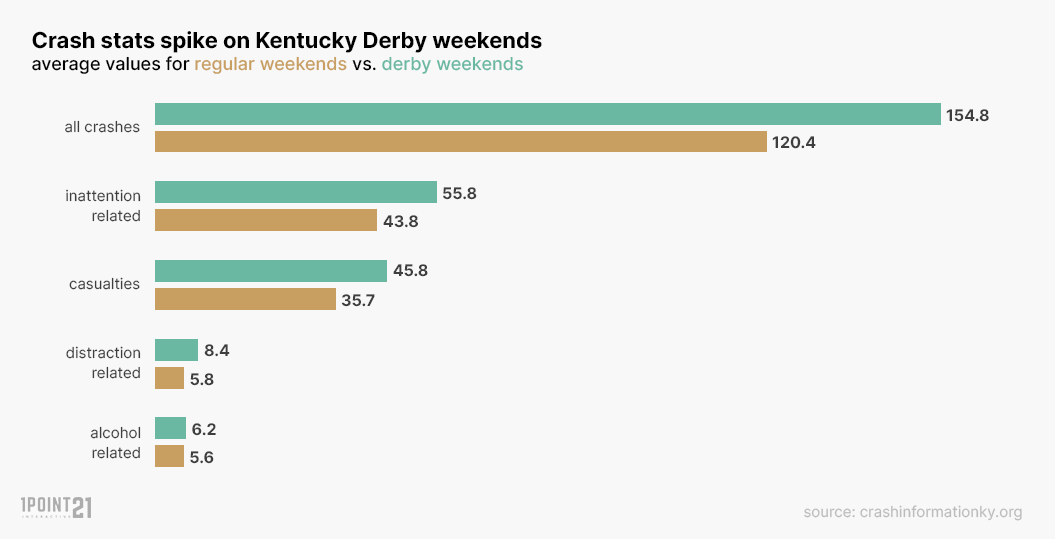
***POST DERBY UPDATE: According to data reported to the Kentucky State Police, there were only 55 motor vehicle collisions during the Kentucky Derby Weekend in 2021 – that is nearly 64 percent fewer crashes than the five-year average. However, despite significantly fewer crashes, injuries remained at pre-pandemic levels with 41 – just four fewer than the event average. This means that the collisions that did occur were much more likely to result in injury. In fact, 75 percent of crashes reported involved at least one injury.**** After being moved to September last year due to the Coronavirus pandemic, the 2021 Kentucky Derby is back. On the first weekend in May, as many as 50,000 people will converge on Churchill Downs in South Louisville. While the race has a clear cultural and economic impact on the surrounding areas each year, how else does it affect Lousiville? It turns out that Louisville roads are much more dangerous when the Derby comes to town. We analyzed five years of crash data and found that motor vehicle crashes spike by 29 percent and injuries increase by 28 percent during Kentucky Derby weekends. Our analysis compared Kentucky Derby weekends from 2015 – 2019 to the average weekend in Lousiville (we did not include 2020 due to the fact that the date was moved and the race did not allow spectators). During these five years, Louisville averaged nearly 155 crashes and 46 injuries during Kentucky Derby weekends, compared to 120 crashes and 36 injuries on typical weekends.  Crashes attributed to inattention and distraction also increase sharply on Derby weekends, at 27 and 46 percent respectively. Perhaps surprisingly, but pleasantly so, crashes involving alcohol typically see a much less drastic rise with 10 percent more occurring during the Kentucky Derby.
Time of Day
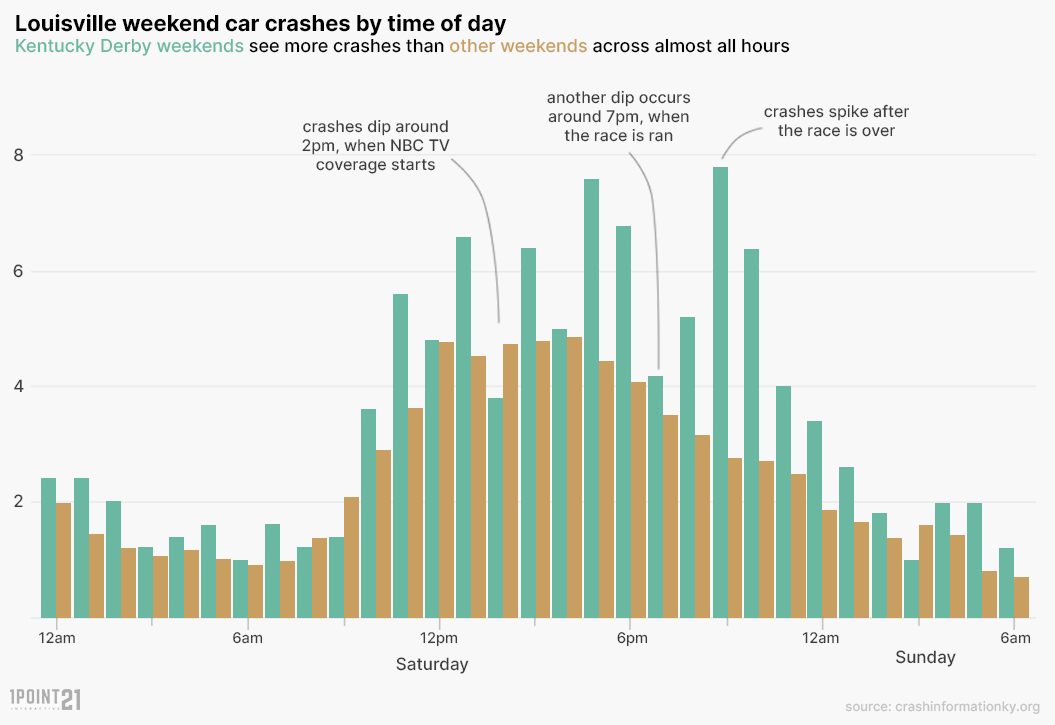
Overall, crashes are up during Derby weekends nearly every hour. However, there are some interesting and drastic dips and spikes that coincide with coverage of the races. Most notably, crashes dip around 2 p.m. when TV coverage starts, then increase again before dropping sharply again around 7 p.m. Finally, collisions spike at 9 p.m. when the race and most of the coverage are over. 
Where Do Crashes Increase the Most?
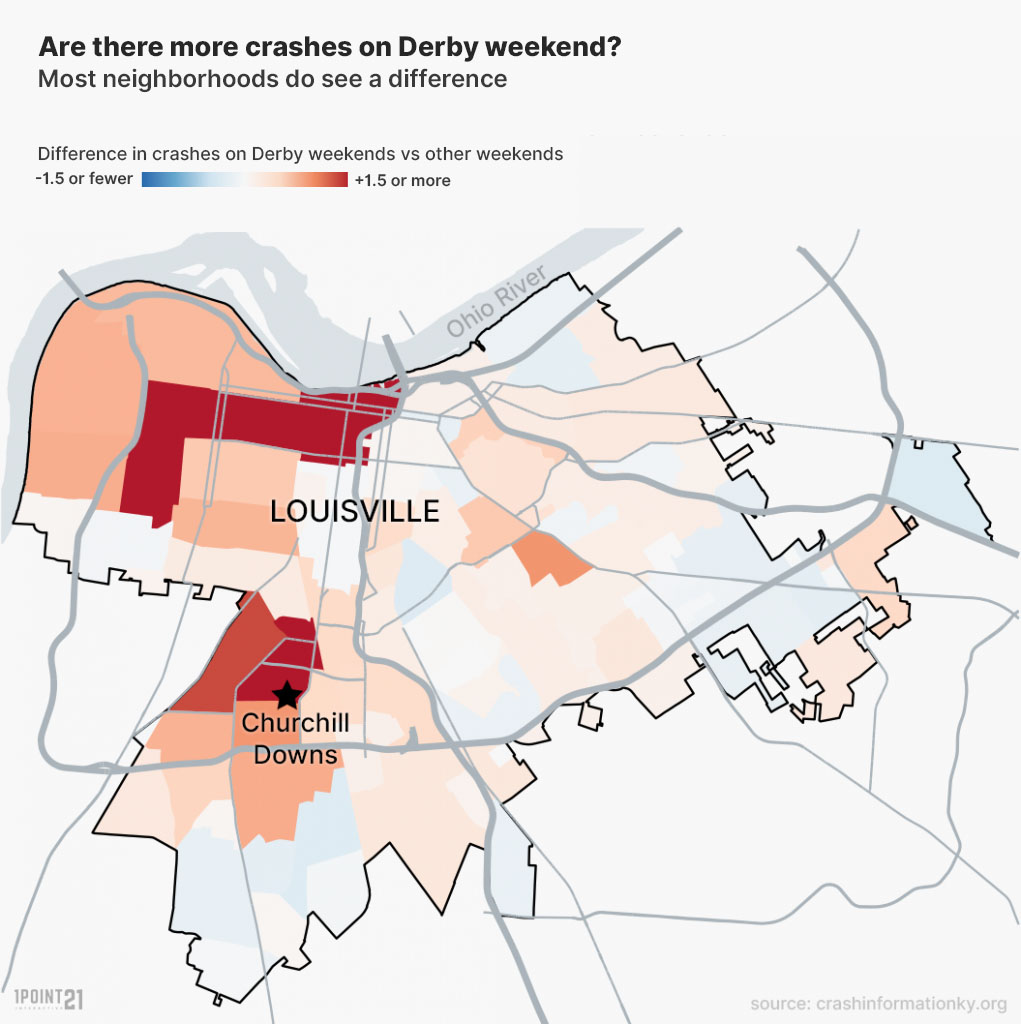
As you might expect, the neighborhoods that see the largest increase in crashes are those where spectators go to watch the race and the corridors around them – the Central Business District, South Lousiville (where Churchill Downs is located), and Russell. In fact, South Louisville sees an average of 4.2 crashes on Derby weekends compared to 1.3 on typical weekends – an increase of 212 percent. 
What to expect in 2021?
While the anticipated crowd of 45,000 – 50,000 people is well below normal spectator levels, what we’ve learned from the last year is that we have no idea what to expect. Despite overall road traffic being down sharply last year, traffic injuries and fatalities across the country actually increased. Alcohol use and abuse have also increased in the adult population throughout the nation. Further, people have been locked away for over a year and we’ve seen it manifest itself in strange, sometimes tragic ways. In short, this year may or may not follow the trends that we’ve found over our study period. Crashes could go down. Or alcohol-related crashes, for example, may increase at a higher rate than in previous years. The most important thing you can do this weekend is to make safe choices. Don’t drink and drive. Whether you go to Churchill Downs, watch the Derby from a bar or restaurant, or view it at a friend or acquaintance’s home, get a sober ride home. Avoid distraction. Inattention and distraction-related collisions increase significantly during Derby weekends. Keep your mind and eyes on the road and your surroundings. Obey all traffic signs and signals. Maintain the legal speed limit, don’t run red lights (or strain to ‘make’ yellow lights), and be aware of others on the road.
Data and Methodology
The data examined in this study came from the Kentucky State Police for the years 2015 – 2019. 1point21 Interactive conducted the analysis of the data at the request of Hendy Johnson Vaughn Emery. If you would like to report on or share the data or images contained in this study, please credit Hendy Johnson by linking to this page.
- Categories:
- North America
- Studies

