Children Killed by Guns: A State by State Examination
On the heels of the tragedy in Uvalde, Texas, the gun violence epidemic is at the very front of the national conversation – and with good reason. Even before the events of late May, 2022, firearms became the number cause of death in children, surpassing motor vehicle collisions for the first time in U.S. history.
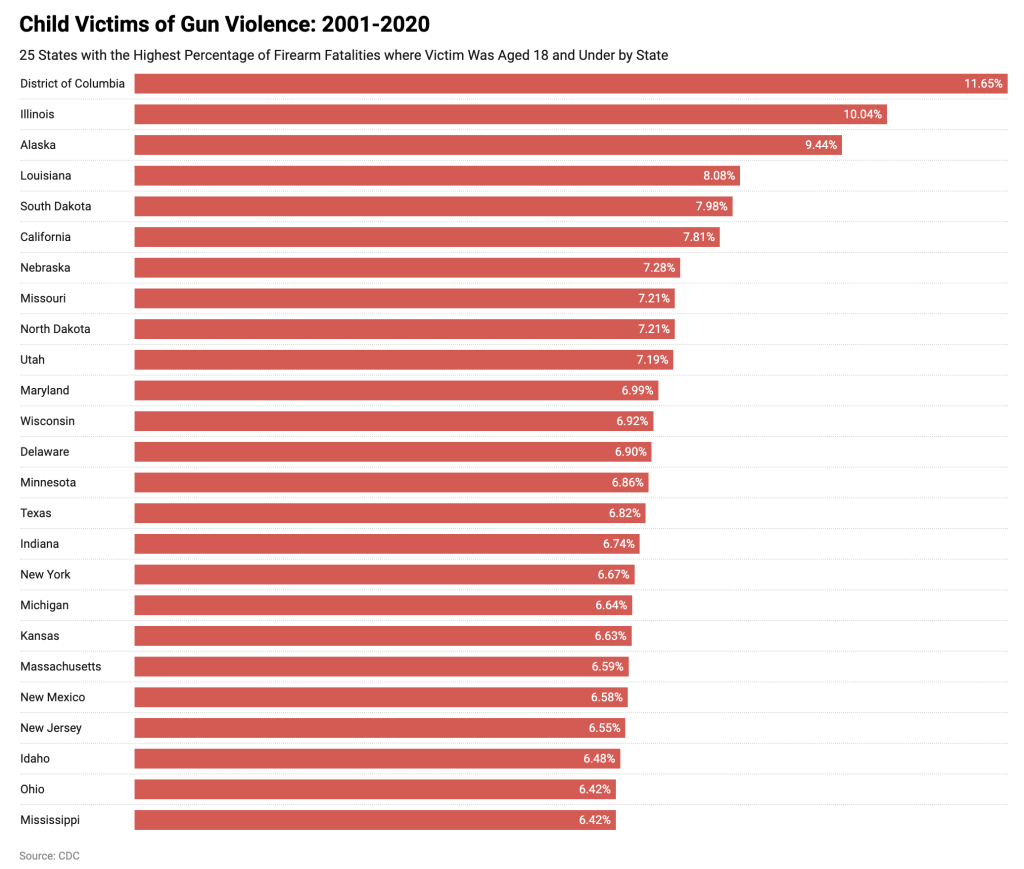
While gun violence is a widespread issue, it is worse and disproportionately affects children in some states than others. This post examines data from the U.S. Center for Disease Control to find out where firearm deaths are highest and in which states children make up the highest share of deaths.
U.S. Firearm Deaths from 2001 – 2020
The table below shows all firearm fatalities by state along with the rate per 100,000, totals and rates when the victim was aged 18 and under, and the percentage of total fatalities where the victim was 18 and under.
| State | 18U Deaths | 18U Rate | Total Deaths | Total Rate | % 18 & Under |
|---|---|---|---|---|---|
| Alabama | 985 | 4.2 | 17365 | 18.3 | 5.67 |
| Alaska | 263 | 6.7 | 2786 | 19.8 | 9.44 |
| Arizona | 1121 | 3.4 | 19641 | 15.4 | 5.71 |
| Arkansas | 595 | 4 | 9740 | 16.8 | 6.11 |
| California | 4966 | 2.6 | 63615 | 8.5 | 7.81 |
| Colorado | 751 | 2.9 | 12745 | 12.5 | 5.89 |
| Connecticut | 213 | 1.3 | 3684 | 5.2 | 5.78 |
| Delaware | 126 | 2.9 | 1826 | 10.2 | 6.90 |
| District of Columbia | 294 | 12 | 2524 | 20.2 | 11.65 |
| Florida | 2397 | 2.8 | 47156 | 12.4 | 5.08 |
| Georgia | 1655 | 3.2 | 26676 | 13.8 | 6.20 |
| Hawaii | 25 | 0.4 | 900 | 3.3 | 2.78 |
| Idaho | 278 | 3.1 | 4288 | 13.7 | 6.48 |
| Illinois | 2440 | 3.8 | 24309 | 9.6 | 10.04 |
| Indiana | 1088 | 3.2 | 16137 | 12.5 | 6.74 |
| Iowa | 299 | 1.9 | 4662 | 7.6 | 6.41 |
| Kansas | 446 | 3 | 6727 | 11.9 | 6.63 |
| Kentucky | 654 | 3.1 | 12631 | 14.6 | 5.18 |
| Louisiana | 1462 | 6.1 | 18086 | 19.8 | 8.08 |
| Maine | 89 | 1.5 | 2525 | 9.5 | 3.52 |
| Maryland | 909 | 3.2 | 13007 | 11.2 | 6.99 |
| Massachusetts | 303 | 1 | 4595 | 3.5 | 6.59 |
| Michigan | 1528 | 3.1 | 23004 | 11.5 | 6.64 |
| Minnesota | 531 | 2 | 7735 | 7.3 | 6.86 |
| Mississippi | 712 | 4.5 | 11091 | 18.8 | 6.42 |
| Missouri | 1343 | 4.5 | 18618 | 15.6 | 7.21 |
| Montana | 215 | 4.5 | 3427 | 17.3 | 6.27 |
| Nebraska | 229 | 2.4 | 3145 | 8.6 | 7.28 |
| Nevada | 467 | 3.5 | 8494 | 15.9 | 5.50 |
| New Hampshire | 57 | 0.9 | 2135 | 8.1 | 2.67 |
| New Jersey | 585 | 1.4 | 8934 | 5.1 | 6.55 |
| New Mexico | 446 | 4.2 | 6782 | 16.8 | 6.58 |
| New York | 1261 | 1.4 | 18895 | 4.9 | 6.67 |
| North Carolina | 1377 | 2.9 | 24500 | 12.9 | 5.62 |
| North Dakota | 104 | 3.1 | 1443 | 10.4 | 7.21 |
| Ohio | 1609 | 2.8 | 25054 | 10.9 | 6.42 |
| Oklahoma | 748 | 3.8 | 11734 | 15.7 | 6.37 |
| Oregon | 367 | 2 | 8971 | 11.6 | 4.09 |
| Pennsylvania | 1725 | 2.9 | 28296 | 11.2 | 6.10 |
| Rhode Island | 51 | 1.1 | 896 | 4.2 | 5.69 |
| South Carolina | 881 | 3.9 | 14623 | 15.8 | 6.02 |
| South Dakota | 135 | 3.1 | 1691 | 10.3 | 7.98 |
| Tennessee | 1206 | 3.9 | 20612 | 16.3 | 5.85 |
| Texas | 3909 | 2.7 | 57307 | 11.3 | 6.82 |
| Utah | 437 | 2.4 | 6082 | 11 | 7.19 |
| Vermont | 52 | 1.9 | 1267 | 10.2 | 4.10 |
| Virginia | 1075 | 2.8 | 17993 | 11.3 | 5.97 |
| Washington | 721 | 2.2 | 13099 | 9.6 | 5.50 |
| West Virginia | 211 | 2.6 | 5632 | 15.4 | 3.75 |
| Wisconsin | 719 | 2.6 | 10394 | 9.2 | 6.92 |
| Wyoming | 124 | 4.4 | 1964 | 17.8 | 6.31 |
Where are Children Disproportionately Killed by Guns?
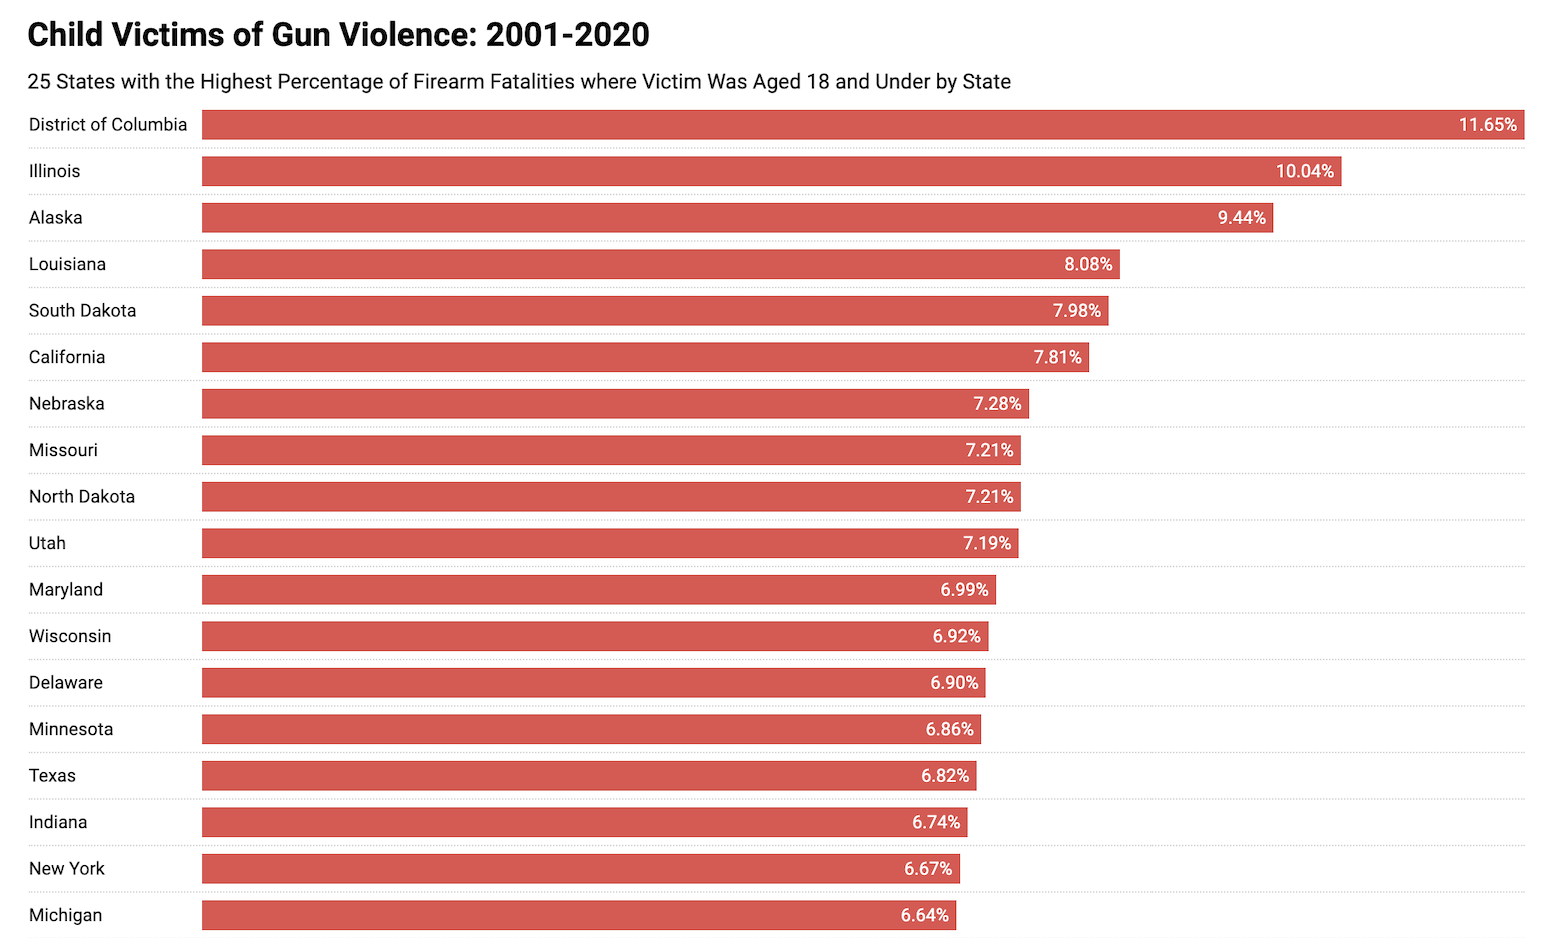
Where are children disproportionately killed by firearms? The District of Columbia, Illinois, and Alaska lead the way. Nationally, 6.5 percent of those killed by firearms from 2001 to 2020 were aged 18 and under. However, in D.C., nearly 12 percent of firearm fatalities were victims aged 18 and under, followed by 10 percent in Illinois, and 9.4 percent in Alaska. The three states with the lowest share – read where children are killed less in comparison to adults – were New Hampshire (2.67 percent), Hawaii (2.78 percent), and Main (3.52 percent).

- Categories:
- Uncategorized

